提示:本节课最终代码为:feature/s24。
作为开发,我们一般都局限在功能上的单元测试,对一些性能上的细节,我们往往没有去关注,如果我们在上线的时候对项目整体性能没有全面的了解的话,当流量越来越大时,可能会出现各种各样的问题,比如 CPU 占用高、内存使用率高等。为了避免这些性能瓶颈,我们在开发的过程中需要通过一定的手段来对程序进行性能分析。
Go 语言已经为开发者内置配套了很多性能调优监控的好工具和方法,这大大提升了我们 profile 分析的效率,借助这些工具我们可以很方便地来对 Go 程序进行性能分析。在 Go 语言开发中,通常借助于内置的 pprof 工具包来进行性能分析。
Go语言中通常如何进行性能分析
如果你刚接触 Go 语言开发,之前没有从事过代码性能优化之类的学习和实战,可能对如何进行代码性能优化一头雾水。本节会从性能优化流程、常见的代码优化方法、数据采集方式、数据分析方式等方面去介绍如何进行程序性能优化。
代码性能优化流程
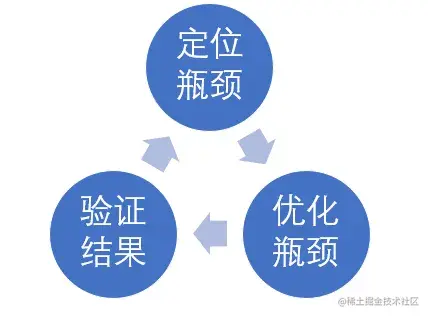
这里来介绍下,Go 中性能分析的流程,如下图所示:

定位瓶颈:运行服务 -> 采集运行数据 -> 分析数据 -> 定位瓶颈;
优化瓶颈:按照瓶颈分类,采取针对性的优化措施;
验证效果:优化后需要再次运行,观察瓶颈是否消除,是否有新的瓶颈出现,然后继续步骤 1。
在程序开发中,不建议过早的优化程序,建议放在最后进行性能优化。另外,一个应用程序可能有很多性能瓶颈,我们应该根据需要按需进行优化。过度的优化通常会导致代码可读性变差。在优化的过程中,要保证程序逻辑的正确性,避免引入 BUG。
常见的代码优化方法
这里简单列举下常见的代码优化方法。通常我们会对 CPU 占用率、内存消耗、磁盘读写性能、网络流量消耗进行优化。通过优化最终减小对这些资源的消耗。
CPU 占用率(减小)
- 更高效的算法和数据结构:如 map 用于查找,根据场景选择合适的算法;
- 复用:cache,池化等;
- 并发:利用多核能力;
- 异步消息队列;
- 代码写法:如切片 map 预分配大小避免频繁扩容。
内存消耗(减小)
- 避免无意义的内存分配;
- 内存复用;
- 栈内存替代堆内存。
磁盘读写性能(减小)
- 合批写回;
- 定期清理;
- 文件大小拆分。
网络流量消耗(减小)
压缩省流量;
合批发送减少系统调用;
部署方式调整,采用更高效的网络通信方式(如同机共享内存,同机房内网);
通信协议调整,如 TCP 代替 HTTP,长连接代替短连接,可靠 UDP 代替 TCP 等。
数据采集方式
性能分析的第一步,便是运行程序,采集性能数据。Go 语言有以下几种性能数据采集方式:
Benchmark:这是最简单、直接的性能数据采集方式,通常用来采集单个函数的执行性能数据;
通过
runtime/pprof包采集:通过在 Go 代码中使用runtime/pprof包进行采集。一般用于应用程序执行一段时间后,就会结束的情况;通过
net/http/pprof包采集:通过在 Go 代码中使用net/http/pprof包进行采集。这种方式主要用于程序一直在跑的场景;日志:通过代码中统计时间然后打日志的方式来记录;
Metrics:代码中记录数据,然后上报到监控平台或本地文件中查看,相比日志方式更正式和灵活。
其中第 1、2、3 种方式是用的最多的。接下来,我分别来介绍这些性能数据采集方式。第1、2、3种产生的 profile 文件,都可以使用 go tool pprof 工具进行性能数据查看,并根据数据进行性能分析。关于如何看懂 pprof 信息,请参考官方文档 Profiling Go Programs。关于如何做性能分析,请参考郝林大神的文章 go tool pprof。
通过编写 Go 的 BenchmarkXXX 函数,然后运行,可指定采集 CPU、内存等性能数据。例如,我们编写以下性能测试用例(代码位于 performance/benchmark/benchmark_test.go):
package benchmarkimport ("math""testing")func BenchmarkExp(b *testing.B) {for i := 0; i < b.N; i++ {_ = math.Exp(3.5)}}
执行以下命令,采集性能数据:
$ go test -bench=BenchmarkExp -benchmem -cpuprofile cpu.profile -memprofile mem.profilegoos: linuxgoarch: amd64pkg: github.com/marmotedu/miniblogdemo/performance/benchmarkcpu: Intel(R) Xeon(R) Platinum 8255C CPU @ 2.50GHzBenchmarkExp-16 100000000 11.15 ns/op 0 B/op 0 allocs/opPASSok github.com/marmotedu/miniblogdemo/performance/benchmark 1.243s
命令行参数解析:
-bench=BenchmarkExp指定以 benchmark 的方式运行;-benchmem表示在收集 CPU 的信息外还额外收集内存数据;-cpuprofile指定输出 CPU 的 profile;-memprofile指定输出 mem 的 profile。
运行后可以输出单次操作的耗时和内存消耗,而且生成的 profile 文件可以通过 go tool pprof cpu.profile 查看具体信息。
上述命令控制台输出各项指标含义如下:
BenchmarkExp-16:表示 GOMAXPROC 为 16;
100000000:表示共执行 100000000 次;
11.15 ns/op:表示每次耗时 11.15 ns;
0 B/op:表示每次操作分配 0 字节;
0 allocs/op:表示每次操作分配 0 次内存。
上述命令,也是在当前目录会生成 cpu.profile、mem.profile、xxx.test 文件,可通过 go tool pprof xxx.test xxx.profile 来查看详细信息,输入 top 查看 cpu 占比和分配内存占比排名。例如:
$ go tool pprof benchmark.test cpu.profileFile: benchmark.testType: cpuTime: Jan 30, 2023 at 10:24am (CST)Duration: 1.24s, Total samples = 1.12s (90.42%)Entering interactive mode (type "help" for commands, "o" for options)(pprof) topShowing nodes accounting for 1120ms, 100% of 1120ms totalflat flat% sum% cum cum%950ms 84.82% 84.82% 950ms 84.82% math.archExp130ms 11.61% 96.43% 1120ms 100% github.com/marmotedu/miniblogdemo/performance/benchmark.BenchmarkExp40ms 3.57% 100% 990ms 88.39% math.Exp (inline)0 0% 100% 1120ms 100% testing.(*B).launch0 0% 100% 1120ms 100% testing.(*B).runN(pprof)
通过在 Go 代码中使用 runtime/pprof 包,可以采集 CPU 信息、内存信息、协程信息等。生成的 profile 文件可以使用 go tool pprof xxx去查看详细信息。例如,编写以下程序来收集性能数据(代码位于 performance/runtimepprof/main.go):
package mainimport ("flag""log""os""runtime""runtime/pprof")var cpuprofile = flag.String("cpuprofile", "", "write cpu profile to `file`")var memprofile = flag.String("memprofile", "", "write memory profile to `file`")func main() {flag.Parse()if *cpuprofile != "" {f, err := os.Create(*cpuprofile)if err != nil {log.Fatal("could not create CPU profile: ", err)}defer f.Close() // error handling omitted for exampleif err := pprof.StartCPUProfile(f); err != nil {log.Fatal("could not start CPU profile: ", err)}defer pprof.StopCPUProfile()}// ... rest of the program ...if *memprofile != "" {f, err := os.Create(*memprofile)if err != nil {log.Fatal("could not create memory profile: ", err)}defer f.Close() // error handling omitted for exampleruntime.GC() // get up-to-date statisticsif err := pprof.WriteHeapProfile(f); err != nil {log.Fatal("could not write memory profile: ", err)}}}
执行以下命令收集性能数据:
$ go run main.go -cpuprofile=cpu.profile -memprofile=mem.profile
以上命令会在当前目录下生成 cpu.profile 和 mem.profile 文件。之后,你可以使用 go tool pprof xxx去查看对应的性能数据。
如果你想测试 Web 服务的接口性能,通常可以通过在 Go 代码中导入 net/http/pprof 包,之后可以通过浏览器、wget、go tool pprof 等方式来动态收集性能数据。例如,编写以下程序来收集性能数据(代码位于 performance/nethttppprof/main.go):
package mainimport ("fmt""log""net/http"_ "net/http/pprof""time")func main() {log.Printf("Listen at port: 6060")go func() {http.ListenAndServe("0.0.0.0:6060", nil)}()for {_ = fmt.Sprint("test sprint")time.Sleep(time.Millisecond)}}
执行以下命令运行程序:
$ go run main.go
之后,可以打开一个新的终端,执行以下命令,来动态收集性能数据:
采集 CPU 数据:
go tool pprof ``http://localhost:6060/debug/pprof/profile;采集正在使用的内存数据:
go tool pprof ``http://localhost:6060/debug/pprof/heap采集正在使用的内存数据;采集累计使用的内存数据:
go tool pprof -alloc_space ``http://localhost:6060/debug/pprof/heap;采集协程数据:
go tool pprof ``http://localhost:6060/debug/pprof/goroutine;采集 trace 数据:
wget ``http://localhost:6060/debug/pprof/trace?seconds=5`` -O nethttppprof.trace。
之后,就可以使用 pprof 工具进行性能数据查看并分析。
通过代码中统计时间然后打日志的方式来记录。
代码中记录数据,然后上报到监控平台或本地文件中查看,相比日志方式,更正式和灵活。
数据分析方式
有了性能数据,接下来,我们就可以进行性能分析,并进行性能优化。有以下 3 种方式可以用来进行性能分析:
使用 go tool pprof xxx.profile 命令打开 profile,然后可以在 pprof 命令的交互界面进行性能分析:
svg:生成函数调用的消耗图(需要安装 graphviz),比如 CPU 占比、分配内存占比、协程占比等(与采集的数据有关);traces:可以打印出调用堆栈中的资源消耗情况;list:用来搜索相关模块的每行代码消耗资源情况;top:查看消耗最高的地方;tree:包含各个主要函数的消耗情况以及子函数的消耗。
通过 svg 图,可以直观看出哪些地方占比高(比如 mallocgc、syscall 等),这些就是后续需要重点关注的点。
也可在 go tool pprof -http=0.0.0.0:6060 xxxx.profile 来启动一个 Web 服务,通过浏览器访问分析结果。
执行 go tool trace -http=0.0.0.0:6061 xxx.trace,然后通过浏览器打开,之后进行操作。可以通过 trace 查看协程情况、调度情况、具体执行细节等。可用来分析执行延迟和并发问题。
trace 分析方法可参考:go的请求追踪神器go tool trace。
基于通过 net/http/pprof 包采集一节中的测试代码,启动一个 Web 服务,并在一个新的 Linux 终端中,获取 trace 数据,并打开浏览器,查看 trace 的详细信息,操作如下:
步骤一:启动 Web 服务
$ go run main.go
步骤二:获取并查看 trace 信息
$ wget http://localhost:6060/debug/pprof/trace?seconds=5 -O nethttppprof.trace$ go tool trace -http=0.0.0.0:6061 nethttppprof.trace
然后通过浏览器打开 http://xx.xx.xx.xx:6061 来查看 trace 的详细信息。
我们可以使用 go-torch 工具更直观地查看性能数据。go-torch 是 Uber 公司开源的一款针对 Go 程序的火焰图生成工具,能收集 stack traces,并把它们整理成火焰图,直观地呈现给开发人员。go-torch 是基于使用 BrendanGregg 创建的火焰图工具生成直观的图像,很方便地分析 Go 的各个方法所占用的 CPU 的时间。
go-torch 会通过 pprof 生成火焰矢量图 torch.svg,然后使用浏览器打开查看。操作命令如下:
$ git clone https://github.com/brendangregg/FlameGraph.git$ sudo cp FlameGraph/flamegraph.pl /usr/local/bin$ flamegraph.pl -h$ go install github.com/uber/go-torch@latest$ go-torch -h$ go-torch -u http://localhost:6060 -t 30 # 确保 `通过 net/http/pprof 包采集` 步骤中的 Web 服务正在运行INFO[15:17:54] Run pprof command: go tool pprof -raw -seconds 30 http://localhost:6060/debug/pprof/profileINFO[15:18:24] Writing svg to torch.svg
go-torch 会通过 pprof 生成火焰矢量图 torch.svg,然后使用浏览器打开查看:

性能分析实战
上面我们学习了性能分析的方法。这里我们通过一个具体的实战,来看下具体如何进行 Go 代码性能分析。
这里,我们基于代码 feature/s23 来分析 GenShortID 函数的性能。在实际开发中,具体需要分析哪个函数的性能,需要你根据函数功能、代码复杂度、代码实现等情况进行综合判断,以确定需要进行性能分析和调优的函数。
根据之前介绍的性能分析方法,我们采用 Benchmark 方法来分析 GenShortID 函数的 CPU 占用(耗时)情况。具体分析方法如下。
执行以下命令,来获取内存性能数据:
$ cd pkg/util/id$ go test -bench='BenchmarkGenShortID$' -benchtime=30s -benchmem -cpuprofile cpu.profile -memprofile mem.profilegoos: linuxgoarch: amd64pkg: github.com/marmotedu/miniblog/pkg/util/idcpu: Intel(R) Xeon(R) Platinum 8255C CPU @ 2.50GHzBenchmarkGenShortID-16 22413243 1657 ns/op 128 B/op 15 allocs/opPASSok github.com/marmotedu/miniblog/pkg/util/id 38.932s
注意:这里为了能够更准确地测试性能,我们通过 -benchtime=30s 参数,让基准测试连续执行 30s。
这里,我分别来演示分析性能数据时,最常用的 3 种方法:
使用火焰图进行分析;
使用 svg 图片进行分析;
使用 profile 进行分析。
这 3 种方法,你可以根据需要自行选择。一般来说,可以优先选择展示方式更直观的方法,然后根据需要再选择其它方法来分析。
使用火焰图进行分析
执行以下命令生成火焰图:
$ go-torch id.test cpu.profileINFO[17:03:00] Run pprof command: go tool pprof -raw -seconds 30 id_test.go cpu.profileINFO[17:03:00] Writing svg to torch.svg
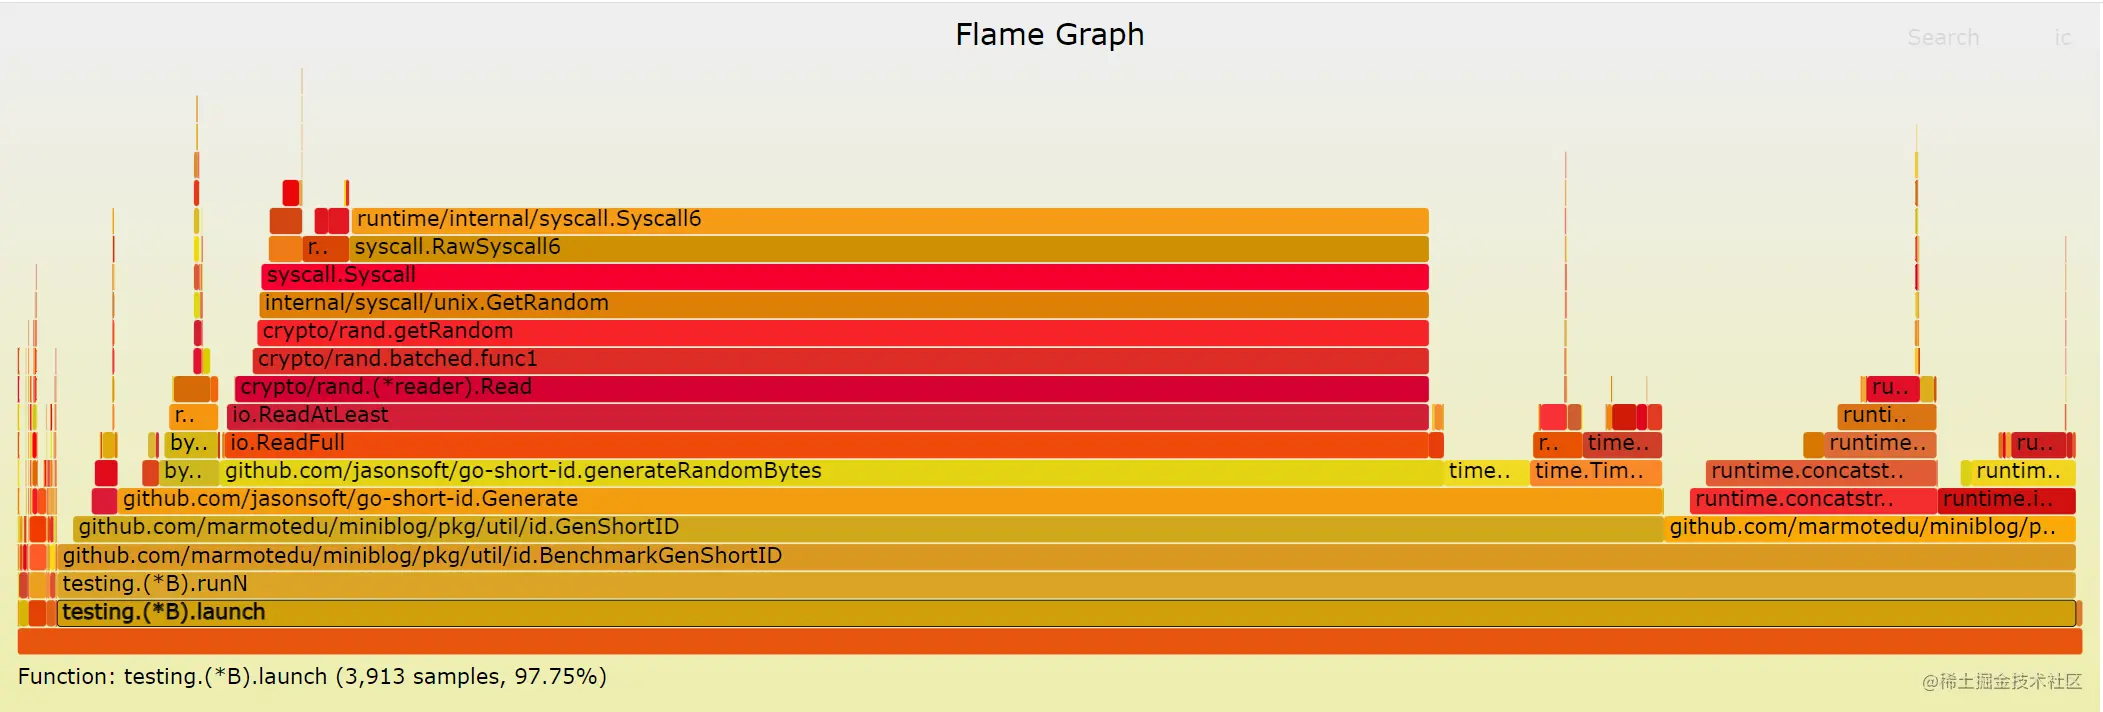
生成的火焰图如下:

Y 轴表示调用栈,每一层都是一个函数。调用栈越深,火焰就越高,顶部就是正在执行的函数,下方都是它的父函数;
X 轴表示抽样数,如果一个函数在 X 轴占据的宽度越宽,就表示它被抽到的次数多,即执行的时间长。注意,X 轴不代表时间,而是所有的调用栈合并后,按字母顺序排列的。
通过火焰图我们就可以更清楚地找出耗时长的函数调用,然后不断修正代码,重新采样,不断优化。火焰图的配色并没有特殊的意义,默认的红、黄配色是为了更像火焰而已。
火焰图是 SVG 格式的图片,可以与用户互动:
鼠标悬浮:火焰的每一层都会标注函数名,鼠标悬浮时会显示完整的函数名、抽样抽中的次数、占据总抽样次数的百分比;
点击放大:在某一层点击,火焰图会水平放大,该层会占据所有宽度,显示详细信息;
搜索:按下 Ctrl + F 会显示一个搜索框,用户可以输入关键词或正则表达式,所有符合条件的函数名会高亮显示。
火焰图原理解读
下面是一个简化的火焰图例子,以帮助你理解火焰图。首先,CPU 抽样得到了三个调用栈。
func_cfunc_bfunc_astart_threadfunc_dfunc_astart_threadfunc_dfunc_astart_thread
上面代码中,start_thread 是启动线程,调用了 func_a。后者又调用了 func_b 和 func_d,而 func_b 又调用了 func_c。
经过合并处理后,得到了下面的结果,即存在两个调用栈,第一个调用栈抽中 1 次,第二个抽中 2 次。
start_thread;func_a;func_b;func_c 1start_thread;func_a;func_d 2
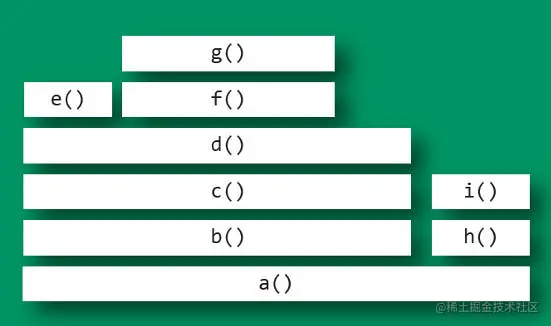
有了这个调用栈统计,火焰图工具就能生成 SVG 图片,如下:

上面图片中,最顶层的函数 g() 占用 CPU 时间最多。d() 的宽度最大,但是它直接耗用 CPU 的部分很少。b() 和 c() 没有直接消耗 CPU。因此,如果要调查性能问题,首先应该调查 g(),其次是 i()。
另外,从图中可知 a() 有两个分支 b()和 h(),这表明 a() 里面可能有一个条件语句,而 b() 分支消耗的 CPU 大大高于 h()。
通过上面的解释,你应该已经能够看懂 GenShortID 的火焰图。
火焰图性能分析
如果要做性能优化,一般来说,我们优化的是自己编写的函数。至于,引用的第三方包,可能存在性能问题,但优化成本很高,除非必要,一般不直接修改第三方包的代码进行优化。当然,你也可以更换能够实现相同功能的其他第三方包。
所以,我们主要关注我们自己开发的函数:GenShortID、toLower 函数。在 GenShortID 函数中,我们编写了 toLower 函数,以将生成的 ID 字符串都转换成小写字符。
从 GenShortID 的火焰图我们可知,在整个调用栈中,我们关注的 2 个函数 GenShortID 和 toLower 耗时分别占比:77.04%、19.94%。再走读 2 个函数的代码,不难发现 GenShortID 中调用了 toLower 函数,toLower 用来将字符串转换成小写。
toLower 是我们自己使用最简单的转换逻辑来实现的。Go 标准库 strings 包也提供了 ToLower 函数,用来将字符串转换成小写,在走读 ToLower 函数,我们不难发现,ToLower 函数转换字符串的实现更加高效。
这时候,我们可以将 toLower 函数替换成 strings.ToLower 以提高性能。替换后的实现见:id.go#L15。
再次执行 go test 测试性能:
$ cd pkg/util/id$ go test -bench='BenchmarkGenShortID$' -benchtime=30s -benchmem -cpuprofile cpu.profile -memprofile mem.profilegoos: linuxgoarch: amd64pkg: github.com/marmotedu/miniblog/pkg/util/idcpu: Intel(R) Xeon(R) Platinum 8255C CPU @ 2.50GHzBenchmarkGenShortID-16 25222014 1360 ns/op 84 B/op 4 allocs/opPASSok github.com/marmotedu/miniblog/pkg/util/id 35.918s
可以看到,优化前执行了 22413243 次,总耗时为 38.932s,每次耗时为 1657 ns/op。优化后执行了 25222014 次,总耗时为 35.918s,每次耗时为 1360 ns/op。性能较优化前提升了 17%。
使用 svg 图片进行分析
svg 图片生成命令如下:
$ go tool pprof id.test cpu.profileFile: id.testType: cpuTime: Jan 30, 2023 at 9:09pm (CST)Duration: 38.92s, Total samples = 40.03s (102.85%)Entering interactive mode (type "help" for commands, "o" for options)(pprof) svgGenerating report in profile001.svg
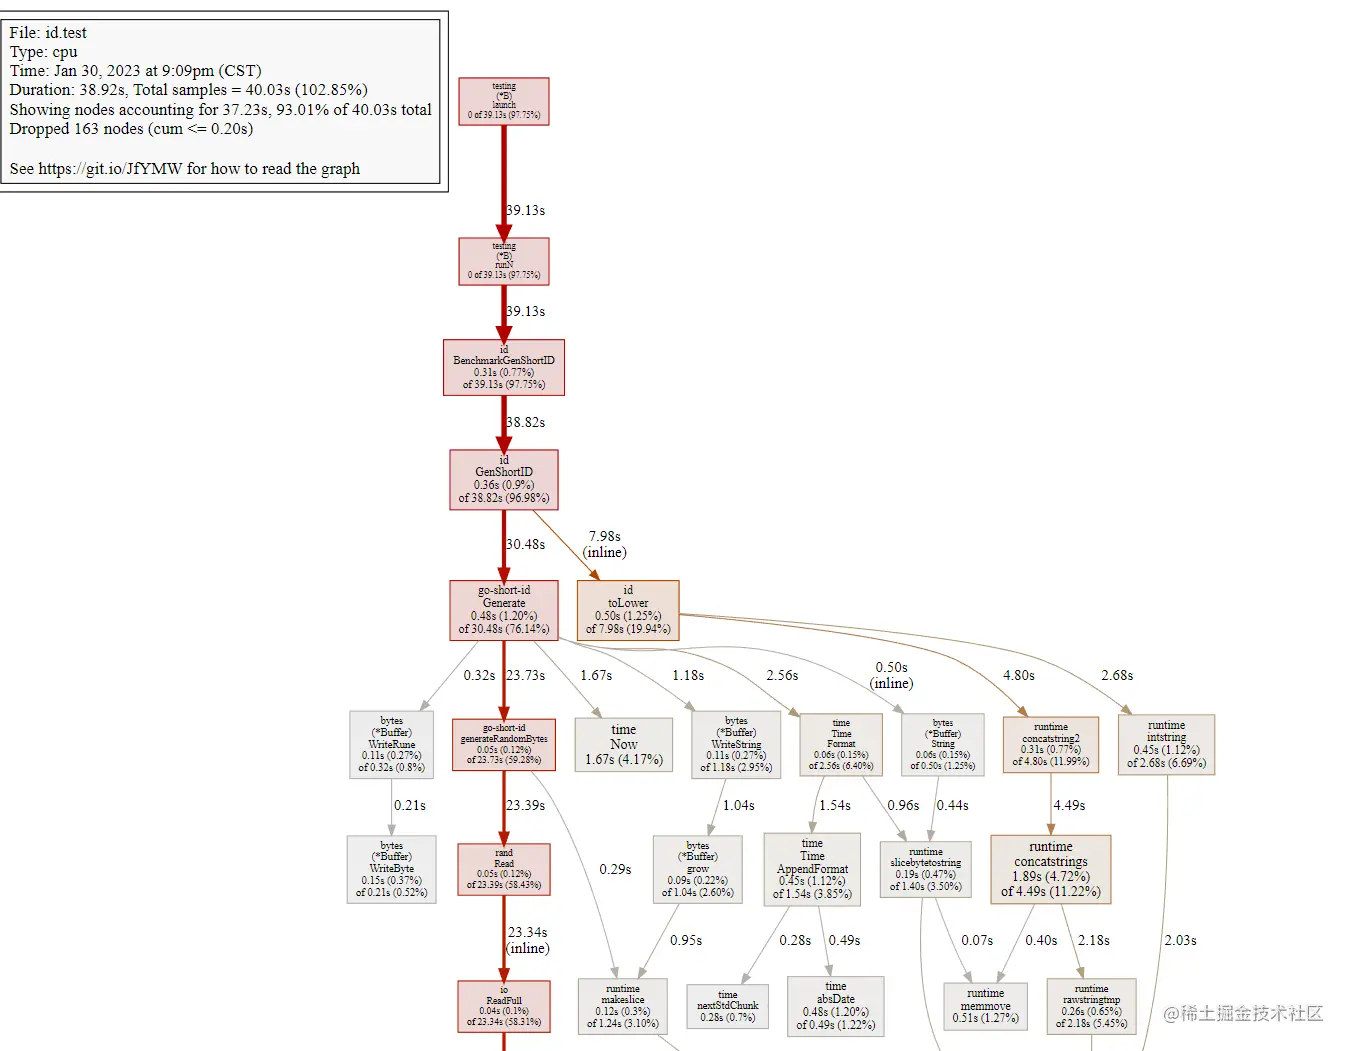
生成的 svg 图片如下:

通过 svg 图片,我们可以清晰看到函数的调用关系,以及每个函数的执行时间和时间占比。根据这些信息,我们不难找出调用耗时高的函数,发现性能问题并优化。
使用 profile 进行分析
执行 go tool pprof id.test cpu.profile 命令来读取并查看性能数据:
$ go tool pprof id.test cpu.profileFile: id.testType: cpuTime: Jan 30, 2023 at 9:09pm (CST)Duration: 38.92s, Total samples = 40.03s (102.85%)Entering interactive mode (type "help" for commands, "o" for options)(pprof) top15Showing nodes accounting for 33.54s, 83.79% of 40.03s totalDropped 163 nodes (cum <= 0.20s)Showing top 15 nodes out of 49flat flat% sum% cum cum%20.88s 52.16% 52.16% 20.88s 52.16% runtime/internal/syscall.Syscall63.15s 7.87% 60.03% 5.23s 13.07% runtime.mallocgc1.89s 4.72% 64.75% 4.49s 11.22% runtime.concatstrings1.67s 4.17% 68.92% 1.67s 4.17% time.Now0.98s 2.45% 71.37% 3.95s 9.87% runtime.rawstring0.81s 2.02% 73.39% 0.81s 2.02% runtime.nextFreeFast (inline)0.59s 1.47% 74.87% 0.60s 1.50% runtime.casgstatus0.51s 1.27% 76.14% 0.51s 1.27% runtime.memmove0.50s 1.25% 77.39% 7.98s 19.94% github.com/marmotedu/miniblog/pkg/util/id.toLower (inline)0.48s 1.20% 78.59% 30.48s 76.14% github.com/jasonsoft/go-short-id.Generate0.48s 1.20% 79.79% 0.49s 1.22% time.absDate0.45s 1.12% 80.91% 2.68s 6.69% runtime.intstring0.45s 1.12% 82.04% 1.54s 3.85% time.Time.AppendFormat0.36s 0.9% 82.94% 38.82s 96.98% github.com/marmotedu/miniblog/pkg/util/id.GenShortID0.34s 0.85% 83.79% 23.15s 57.83% crypto/rand.(*reader).Read
执行 top15 命令查看耗时最高的 15 个函数。从输出中,我们不难发现调用耗时较久的函数。
其实 svg 图片和火焰图中的信息,只是把 profile 文件中的信息以更直观的方式展示给开发者。三种分析方法的分析思路都是相同的。
另外,性能分析为了尽可能做到数据准确,比较推荐的方法是多次测试求平均值。
小结
在 Go 项目开发中,在最后阶段,为了提高接口响应速度,优化产品体验,通常我们要对代码进行性能分析。本节课从代码优化流程、常见的代码优化方法、数据采集方式、数据分析方式等方面详细介绍了如何进行代码优化。最后,通过一个实战,给大家演示了具体如何进行代码性能分析和优化。
